
Occupation mobility is when movements between roles are significant enough to be considered a change in occupation. Understanding these movements helps connect Australians to opportunity and helps employers access the skills they need.
A dynamic labour market relies on people being able to move between roles, occupations and industries as the economy changes. Labour market mobility benefits workers and employers. For workers, moving jobs can help people build skills, find roles that better match their interests and circumstances, and often lift earnings. For employers, mobility broadens access to capability, supporting productivity and easing skills shortages.
Mobility between occupations often reflects changes in the skills a person has acquired through formal education and qualifications, licencing or skills developed through on the job learning.
Jobs and Skills Australia (JSA) has used its Data on Occupation Mobility, a data set constructed from the ABS’ Person Level Integrated Data Asset to demonstrate the yearly movement of people between occupations.
Occupation Mobility Interactive Tool
Loading...

No links available to
No links available from
Total inflow/outflow:
Total movement:
Inflow occupations:
Total inflow:
Outflow occupations:
Total outflow:
Select an occupation
The Occupation Mobility Interactive Tool (OMIT) provides a clear, practical view of occupation mobility. Select an occupation to see the top 10 occupations people moved from and the top 10 they moved over financial years 2021-22 and 2022-23.
For example, people who became Sales Assistants (General) most commonly came from Waiters and Fast Food Cooks. From Sales Assistants (General), people most often moved into broader supervisory or administrative occupations such as Retail Managers (General) and General Clerks.
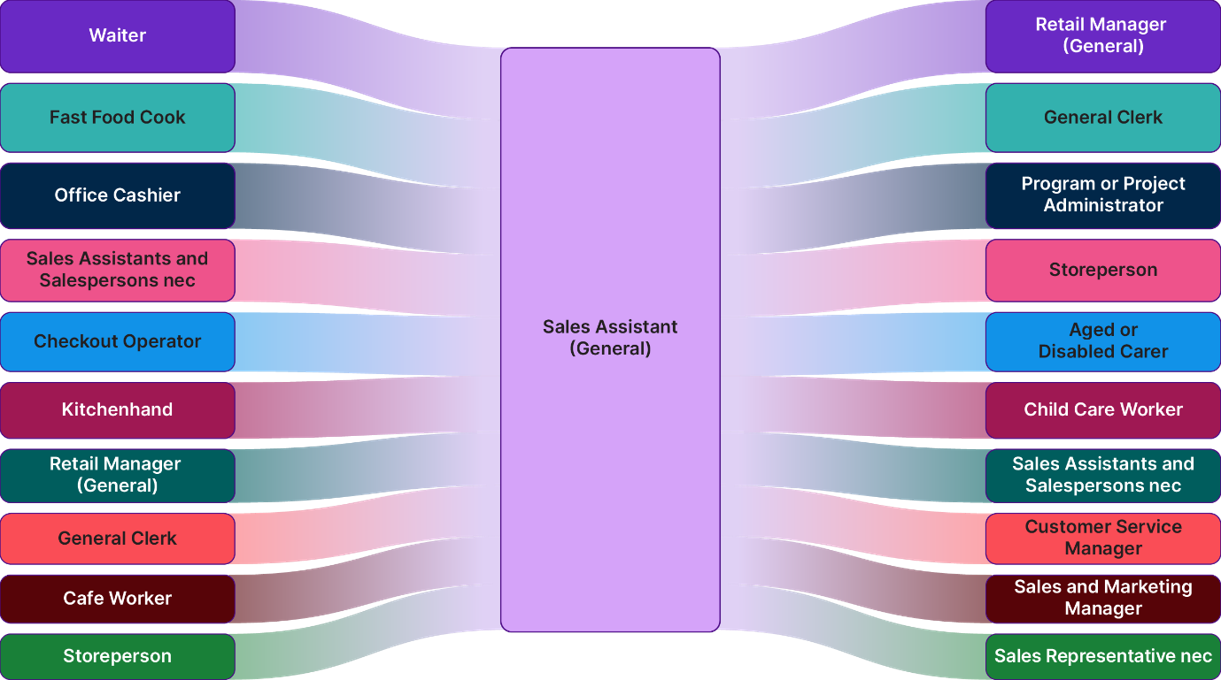
Sales Assistants (General) occupation, top 10 occupation inflows (left) and outflows (right), 2021-22 to 2022-2023.
Source: Jobs and Skills Australia, Data on Occupation Mobility (DOM), 2021-22 to 2022-23, ABS Datalab, filtered at the 6-digit ANZSCO level, top 10 occupation movements. Findings based on use of PLIDA data
Occupation Mobility Graph
The Occupation Mobility Graph shows how occupations are connected across the labour market. It enables consideration of many movements at once and exploration of the breadth of pathways Australians take through work and learning.
In this view, each dot represents an occupation, and each line shows people moving between occupations. Where many occupations are closely connected, they form clusters—groups people commonly move within, often reflecting shared skills, tasks and work contexts.
Using this approach, JSA has identified eight occupation clusters:
- Professional and Clerical
- Arts
- Nursing and Caring
- Agricultural
- Manufacturing
- Social, Education and Service
- Health, Science and Research
- Engineering and ICT.
Focusing on the last three clusters illustrates how skills connect across the labour market and where some of the more visible mobility pathways sit.
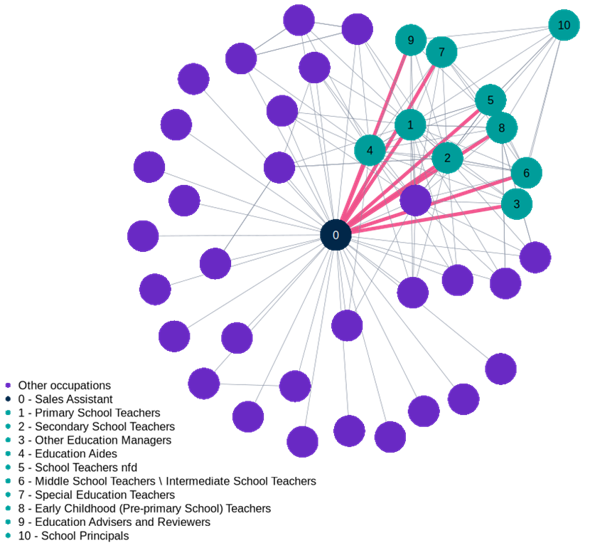
Social, Education and Service cluster - Sales Assistants (General), 2021-22 to 2022-2023
Source: Jobs and Skills Australia, Data on Occupation Mobility (DOM), 2021-22 to 2022-23, ABS Datalab, filtered at the 4-digit ANZSCO level. Findings based on use of PLIDA data.
Sales Assistants (General) sits at the centre of the Social, Education and Service cluster. This graph builds on the OMIT, providing a richer picture by showing the many links between Sales Assistants (General) and other occupations in the Social, Education and Service cluster, while also revealing how those occupations connect to each other and to more distant roles across the cluster.
For readability, we have highlighted a small group of occupations in this cluster that relate to teaching. While these teaching roles require formal qualifications, they can also draw on communication and organisational skills developed through earlier experience in jobs like Sales Assistant (General).
From Sales Assistant (General), some people move into Education Aide roles. With further study, people can progress into primary or secondary teaching, and over time move into senior occupations such as School Principals or Other Education Managers.
This is one pathway among many, reflecting the different choices people make through work, training and study.
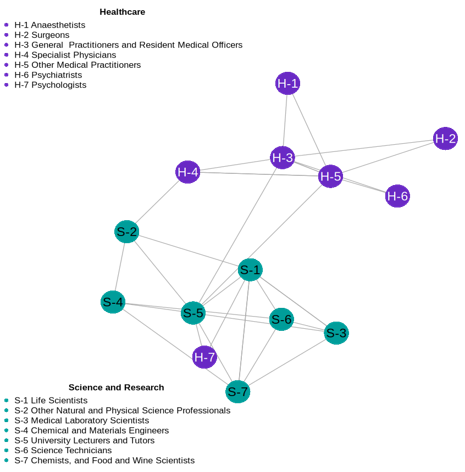
Health, Science and research pathways cluster, 2021-22 to 2022-2023.
Source: Jobs and Skills Australia, Data on Occupation Mobility (DOM), 2021-22 to 2022-23, ABS Datalab, filtered at the 4-digit ANZSCO level. Findings based on use of PLIDA data.
This cluster includes two connected groups: a health care sub-cluster and a science and research sub-cluster. In health care, many pathways branch out from Resident Medical Officers into occupations such as Specialist Physicians, Anaesthetists, Surgeons and Other Medical Practitioners.
The science and research sub-cluster is more interconnected. University Lecturers and Tutors is a major hub, reflecting the role universities play in research and knowledge creation. It connects to occupations such as Life Scientists, Other Natural and Physical Science Professionals, Psychologists, Chemists, Science Technicians and Medical Laboratory Scientists, illustrating how scientific and technical skills transfer across related occupations.
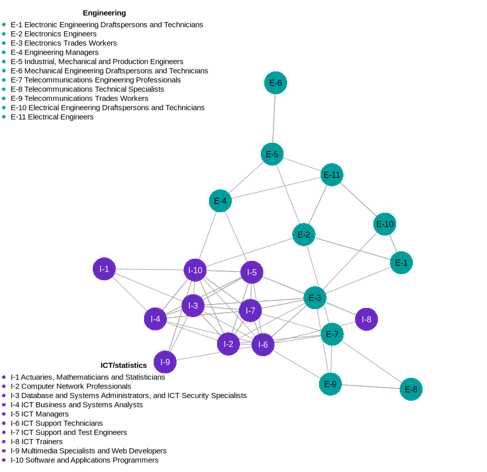
Engineering and ICT cluster, 2021-22 to 2022-2023
Source: Jobs and Skills Australia, Data on Occupation Mobility (DOM), 2022-23, ABS Datalab, filtered at the 4-digit ANZSCO level. Findings based on use of PLIDA data. This cluster shows how Engineering and ICT occupations are connected through shared technical and analytical skills. Engineering roles tend to focus on physical systems and equipment, while ICT roles centre on digital and information based work. The links in the graph suggest overlap in skills and attributes across these areas, supporting movement between occupations. As people progress through a career, they may build on their skills and qualifications through on the job learning or by acquiring additional qualifications.
For more detail on labour market mobility, our methodology, and the Occupation Mobility Graph, please refer to the full report, methodology paper and data.